Low-level Debugger
| Company Academic Project |
Engine N/A |
||
| Platform Windows PC |
Skills C++ |
||
| Role Tool Engineer |
Responsibilities Implementing easy-interpolating debuggers |
Features
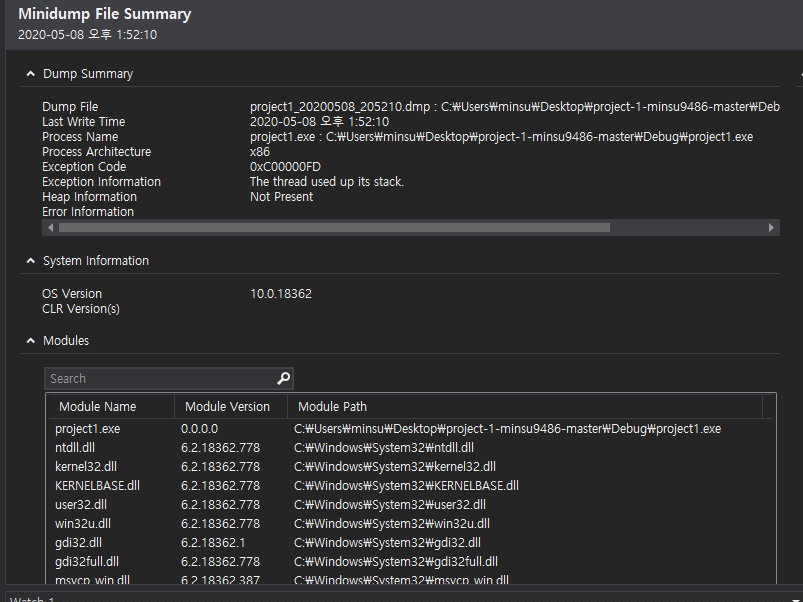
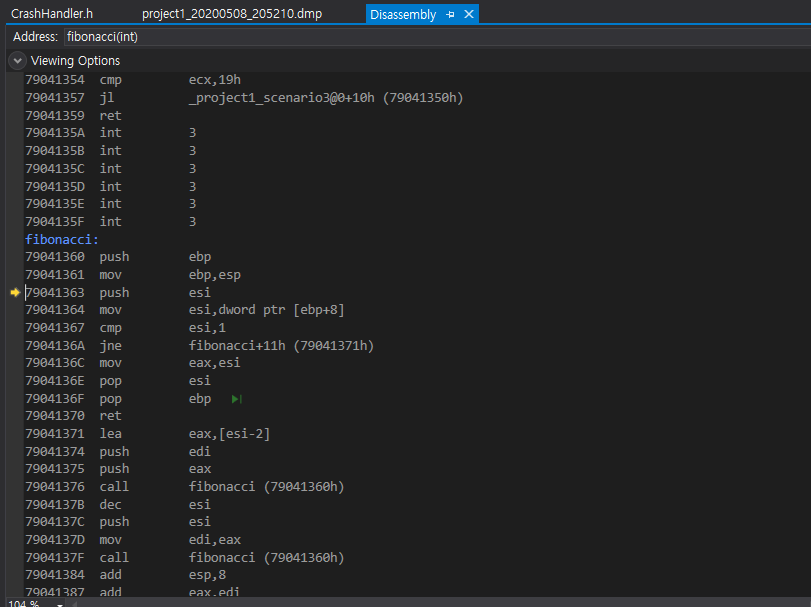
- Crash handler
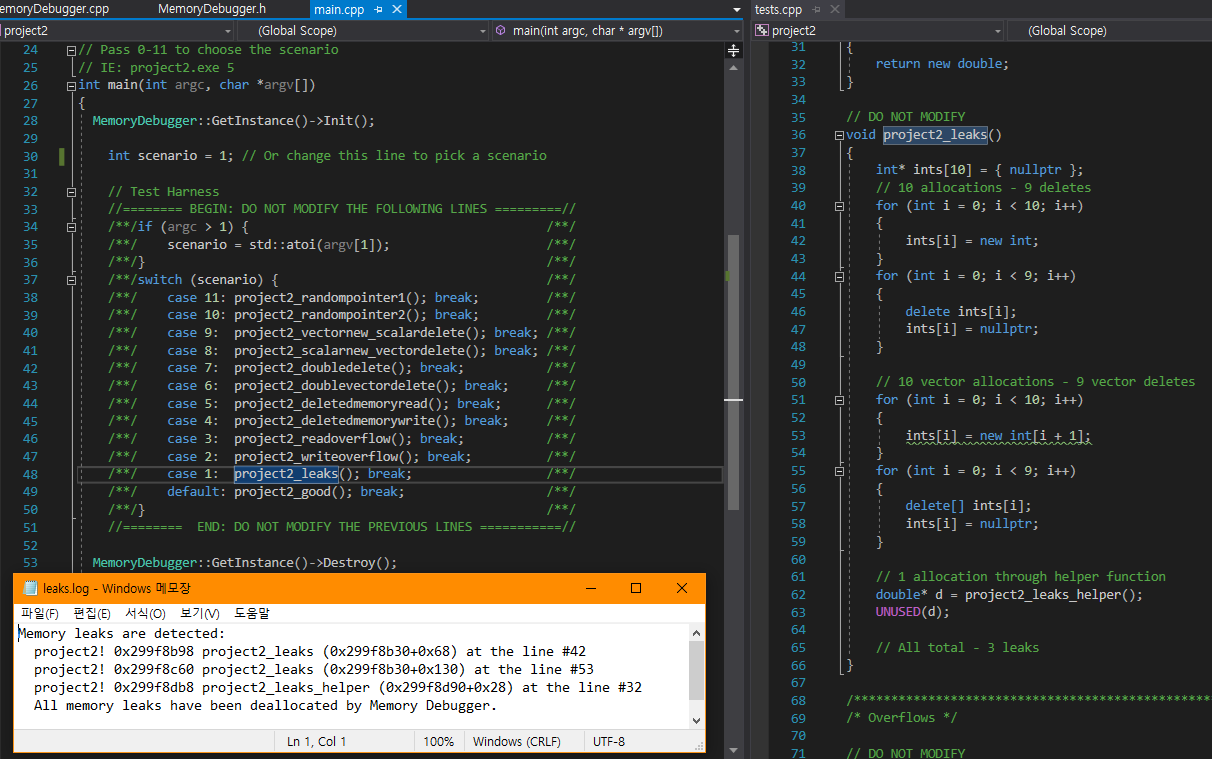
- Memory debugger
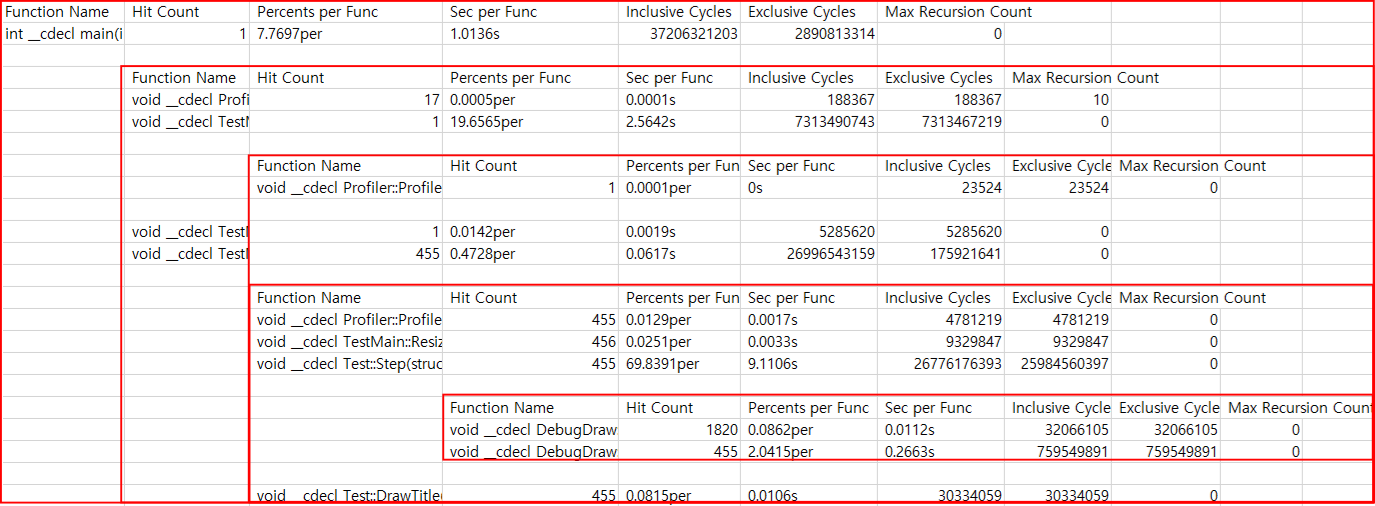
- Instrumented profiler
Crash Handler


Memory Debugger

Instrumented Profiler


Measuring super-accurate time is quite challenging in C++. Although __rdtsc (clock cycles) is primarily used in this profiler, it is, to be honest, not a good idea because OS scheduler could reschedule other threads, processes at arbitrary moments, or slow down the clock.
However, I believe using __rdtsc is enough for my academic purpose which is focused on making structure and understanding how a profiler is working on. To convert clock cycles to a human-understanding format (seconds), sleep_for is used as the following code is written:
Profiler::Profiler() {
 ...
 // Measure the speed of this processor
 uint64 cyclesMeasureStart = __rdtsc();
 // 100ms = 0.1s
 std::this_thread::sleep_for(std::chrono::milliseconds(100));
 uint64 cyclesMeasureEnd = __rdtsc();
 m_CyclesPerSec = cyclesMeasureEnd - cyclesMeasureStart;
}

void Profiler::PrintInfoToCSV(...) {
 ...
 // exclusiveClock is a number of clock cycles by __rdtsc
 // m_CyclesPerSec * 10.f = 1s
 float exclusiveSec = exclusiveClock / (m_CyclesPerSec * 10.f);
 ...
}
